一. pprof 数据采样
pprof 采样数据主要有三种获取方式:
- runtime/pprof: 手动调用
runtime.StartCPUProfile或者runtime.StopCPUProfile等 API来生成和写入采样文件,灵活性高 - net/http/pprof: 通过 http 服务获取Profile采样文件,简单易用,适用于对应用程序的整体监控。通过 runtime/pprof 实现
- go test: 通过
go test -bench . -cpuprofile prof.cpu生成采样文件 适用对函数进行针对性测试
1.1 net/http/pprof
在应用程序中导入import _ "net/http/pprof",并启动 http server即可:
// net/http/pprof 已经在 init()函数中通过 import 副作用完成默认 Handler 的注册
go func() {
    log.Println(http.ListenAndServe("localhost:6060", nil))
}()
之后可通过 http://localhost:6060/debug/pprof/CMD 获取对应的采样数据。支持的 CMD 有:
- goroutine: 获取程序当前所有 goroutine 的堆栈信息。
- heap: 包含每个 goroutine 分配大小,分配堆栈等。每分配 runtime.MemProfileRate(默认为512K) 个字节进行一次数据采样。
- threadcreate: 获取导致创建 OS 线程的 goroutine 堆栈
- block: 获取导致阻塞的 goroutine 堆栈(如 channel, mutex 等),使用前需要先调用
runtime.SetBlockProfileRate - mutex: 获取导致 mutex 争用的 goroutine 堆栈,使用前需要先调用
runtime.SetMutexProfileFraction
以上五个 CMD 都通过runtime/pprof Profile 结构体统一管理,以 Lookup 提供统一查询接口,有相似的返回值(goroutine 堆栈),它们都支持一个 debug URL参数,默认为0,此时返回的采样数据是不可人为解读的函数地址列表,需要结合 pprof 工具才能还原函数名字。 debug=1时,会将函数地址转换为函数名,即脱离 pprof 在浏览器中直接查看。对 goroutine CMD来说,还支持 debug=2,此时将以 unrecovered panic 的格式打印堆栈,可读性更高。如启用net/http/pprof后,http://localhost:6060/debug/pprof/goroutine?debug=2 的响应格式为:
goroutine 18 [chan receive, 8 minutes]:
ngs/core/glog.logWorker(0x18b548a, 0x4, 0x7fff5fbffb0e, 0x0, 0x3, 0xc4200e31a0, 0xc4203627c4)
    /Users/wudaijun/go/src/ngs/core/glog/worker.go:43 +0x19c
created by ngs/core/glog.newLogger
    /Users/wudaijun/go/src/ngs/core/glog/glog.go:51 +0xe4

goroutine 6 [syscall, 8 minutes]:
os/signal.signal_recv(0x0)
    /usr/local/Cellar/go/1.9.1/libexec/src/runtime/sigqueue.go:131 +0xa7
os/signal.loop()
    /usr/local/Cellar/go/1.9.1/libexec/src/os/signal/signal_unix.go:22 +0x22
created by os/signal.init.0
    /usr/local/Cellar/go/1.9.1/libexec/src/os/signal/signal_unix.go:28 +0x41

goroutine 50 [select, 8 minutes]:
context.propagateCancel.func1(0x1cfcee0, 0xc42017a1e0, 0x1cf3820, 0xc42005b480)
    /usr/local/Cellar/go/1.9.1/libexec/src/context/context.go:260 +0x113
created by context.propagateCancel
    /usr/local/Cellar/go/1.9.1/libexec/src/context/context.go:259 +0x1da

...
以上几种 Profile 可在 http://localhost:6060/debug/pprof/ 中看到,除此之外,go pprof 的 CMD 还包括:
- cmdline: 获取程序的命令行启动参数
- profile: 获取指定时间内(从请求时开始)的cpuprof,倒计时结束后自动返回。参数: seconds, 默认值为30。cpuprofile 每秒钟采样100次,收集当前运行的 goroutine 堆栈信息。
- symbol: 用于将地址列表转换为函数名列表,地址通过’+’分隔,如 URL/debug/pprof?0x18d067f+0x17933e7
- trace: 对应用程序进行执行追踪,参数: seconds, 默认值1s
这几个 CMD 因为各种原因没有整合到 Profile 结构中去,但就使用上而言,是没有区别的,URL格式是一致的,因此可以看做一个整体,从各个角度对系统进行数据采样和分析。
1.2 runtime/pprof
runtime/pprof提供各种相对底层的 API 用于生成采样数据,一般应用程序更推荐使用net/http/pprof,runtime/pprof 的 API 参考runtime/pprof或 http pprof 实现。
1.3 go test
通常用net/http/pprof或runtime/pprof对应用进行整体分析,找出热点后,再用go test进行基准测试,进一步确定热点加以优化并对比测试。
# 生成 test 二进制文件, pprof 工具需要用到
▶ go test -c -o tmp.test
# 执行基准测试 BenchAbc,并忽略任何单元测试,test flag前面需要加上'test.'前缀
▶ tmp.test -test.bench BenchAbc -test.run XXX test.cpuprofile cpu.prof
# 与上面两条命令等价,只不过没有保留 test 二进制文件
▶ go test -bench BenchAbc -run XXX -cpuprofile=cpu.prof .
go test可以直接加-cpuprofile -mutexprofilefraction等参数实现prof数据的采样和生成,更多相关参数参考 go test -h。
二. pprof 数据分析
虽然 net/http/pprof提供的数据分析可以通过设置参数后直接在浏览器查看,但 pprof 采样数据主要是用于 pprof 工具的,特别针对 cpuprof, memprof, blockprof等来说,我们需要直观地得到整个调用关系链以及每次调用的详细信息,这是需要通过go tool pprof命令来分析:
go tool pprof [binary] [binary.prof]
# 如果使用的 net/http/pprof 可以直接接 URL
go tool pprof http://localhost:6060/debug/pprof/profile
go pprof 采样数据是非常丰富的,大部分情况下我们只会用到 CPU 和 内存分析,因此这里介绍下 cpu, heap, block 和 mutex 四种 pprof 数据分析。
2.1 cpuprofile
以Profiling Go Programs中的示例代码为例:
▶ go build -o havlak1 havlak1.go
▶ ./havlak1 --cpuprofile=havlak1.prof
# of loops: 76000 (including 1 artificial root node)
▶ go tool pprof havlak1 havlak1.prof
File: havlak1
Type: cpu
Time: Apr 3, 2018 at 3:50pm (CST)
Duration: 20.40s, Total samples = 23.30s (114.24%)
Entering interactive mode (type "help" for commands, "o" for options)
(pprof) top5
Showing nodes accounting for 9.60s, 41.20% of 23.30s total
Dropped 112 nodes (cum <= 0.12s)
Showing top 5 nodes out of 90
      flat  flat%   sum%        cum   cum%
     2.59s 11.12% 11.12%      2.78s 11.93%  runtime.mapaccess1_fast64 /usr/local/Cellar/go/1.9.1/libexec/src/runtime/hashmap_fast.go
     2.26s  9.70% 20.82%      4.97s 21.33%  runtime.scanobject /usr/local/Cellar/go/1.9.1/libexec/src/runtime/mgcmark.go
     2.06s  8.84% 29.66%     13.79s 59.18%  main.FindLoops /Users/wudaijun/Code/goprof/havlak/havlak1.go
     1.39s  5.97% 35.62%      1.39s  5.97%  runtime.heapBitsForObject /usr/local/Cellar/go/1.9.1/libexec/src/runtime/mbitmap.go
     1.30s  5.58% 41.20%      4.14s 17.77%  runtime.mapassign_fast64 /usr/local/Cellar/go/1.9.1/libexec/src/runtime/hashmap_fast.go
top5用于显示消耗 CPU 前五的函数,每一行代表一个函数,每一列为一项指标:
- flat: 采样时,该函数正在运行的次数*采样频率(10ms),即得到估算的函数运行”采样时间”。这里不包括函数等待子函数返回。
- flat%: flat / 总采样时间值
- sum%: 前面所有行的 flat% 的累加值,如第二行 sum% = 20.82% = 11.12% + 9.70%
- cum: 采样时,该函数出现在调用堆栈的采样时间,包括函数等待子函数返回。因此 flat <= cum
- cum%: cum / 总采样时间值
PS: 老的pprof版本貌似显示的是采样次数,比如 flat 为采样时该函数正在运行的次数,这个次数*采样频率即得到采样时间。
go tool pprof 常用命令:
- topN: 输入 top 命令,默认显示 flat 前10的函数调用,可使用 -cum 以 cum 排序
- list Func: 显示函数名以及每行代码的采样分析
- web: 生成 svg 热点图片,可在浏览器中打开,可使用 web Func 来过滤指定函数相关调用树
通过top5命令可以看到,mapaccess1_fast64函数占用的CPU 采样时间最多,通过 web mapaccess1_fast64 命令打开调用图谱,查看该函数调用关系,可以看到主要在DFS 和 FindLoops 中调用的,然后再通过 list DFS查看函数代码和关键调用,得到 map 结构是瓶颈点,尝试转换为 slice 优化,整个过程参考Profiling Go Programs。总的思路就是通过top 和web 找出关键函数,再通过list Func 查看函数代码,找到关键代码行并确认优化方案(辅以 go test Benchmark)。
2.2 memprofile
▶ go build -o havlak3 havlak3.go
▶ ./havlak3 --memprofile=havlak3.mprof
▶ go tool pprof havlak3 havlak3.mprof
File: havlak3
Type: inuse_space
Time: Apr 3, 2018 at 3:44pm (CST)
Entering interactive mode (type "help" for commands, "o" for options)
(pprof) top
Showing nodes accounting for 57.39MB, 100% of 57.39MB total
      flat  flat%   sum%        cum   cum%
   39.60MB 69.00% 69.00%    39.60MB 69.00%  main.FindLoops /Users/wudaijun/Code/goprof/havlak/havlak3.go
   11.29MB 19.67% 88.67%    11.29MB 19.67%  main.(*CFG).CreateNode /Users/wudaijun/Code/goprof/havlak/havlak3.go
    6.50MB 11.33%   100%    17.79MB 31.00%  main.NewBasicBlockEdge /Users/wudaijun/Code/goprof/havlak/havlak3.go
         0     0%   100%    39.60MB 69.00%  main.FindHavlakLoops /Users/wudaijun/Code/goprof/havlak/havlak3.go
         0     0%   100%    17.79MB 31.00%  main.buildBaseLoop /Users/wudaijun/Code/goprof/havlak/havlak3.go
memprofile 也就是 heap 采样数据,go tool pprof 默认显示的是使用的内存的大小,如果想要显示使用的堆对象的个数,则通过go tool pprof --inuse_objects havlak3 havlak3.mprof,其它参数还有--alloc_objects和--alloc_space,分别是分配的堆内存大小和对象个数。在本例中,FindLoops 函数分配了39.60M 堆内存,占到69%,同样,接下来是通过list FindLoops对函数代码进行 review,找出关键数据结构,进行优化。
2.3 blockprofile
1 | var mutex sync.Mutex |
运行程序并 pprof:
▶ go build -o Temp tmp.go
▶ go tool pprof Temp block.bprof
(pprof) top
Showing nodes accounting for 3.37ms, 100% of 3.37ms total
      flat  flat%   sum%        cum   cum%
    2.04ms 60.52% 60.52%     2.04ms 60.52%  sync.(*Mutex).Lock /usr/local/Cellar/go/1.9.1/libexec/src/sync/mutex.go
    1.33ms 39.48%   100%     1.33ms 39.48%  sync.(*WaitGroup).Wait /usr/local/Cellar/go/1.9.1/libexec/src/sync/waitgroup.go
         0     0%   100%     1.33ms 39.48%  main.main /Users/wudaijun/go/src/ngs/test/tmp/tmp.go
         0     0%   100%     2.04ms 60.52%  main.worker /Users/wudaijun/go/src/ngs/test/tmp/tmp.go
         0     0%   100%     3.37ms   100%  runtime.goexit /usr/local/Cellar/go/1.9.1/libexec/src/runtime/asm_amd64.s
         0     0%   100%     1.33ms 39.48%  runtime.main /usr/local/Cellar/go/1.9.1/libexec/src/runtime/proc.go
可以看到程序在 mutex.Lock 上阻塞了2.04ms(worker goroutine), 在 WaitGroup.Wait 上等待了1.33ms(main goroutine),从更上层来看,在 main 函数中一共阻塞了2.04ms,worker函数中阻塞了1.33ms(cum 列),通过 web命令生成 svg 图片在浏览器查看:
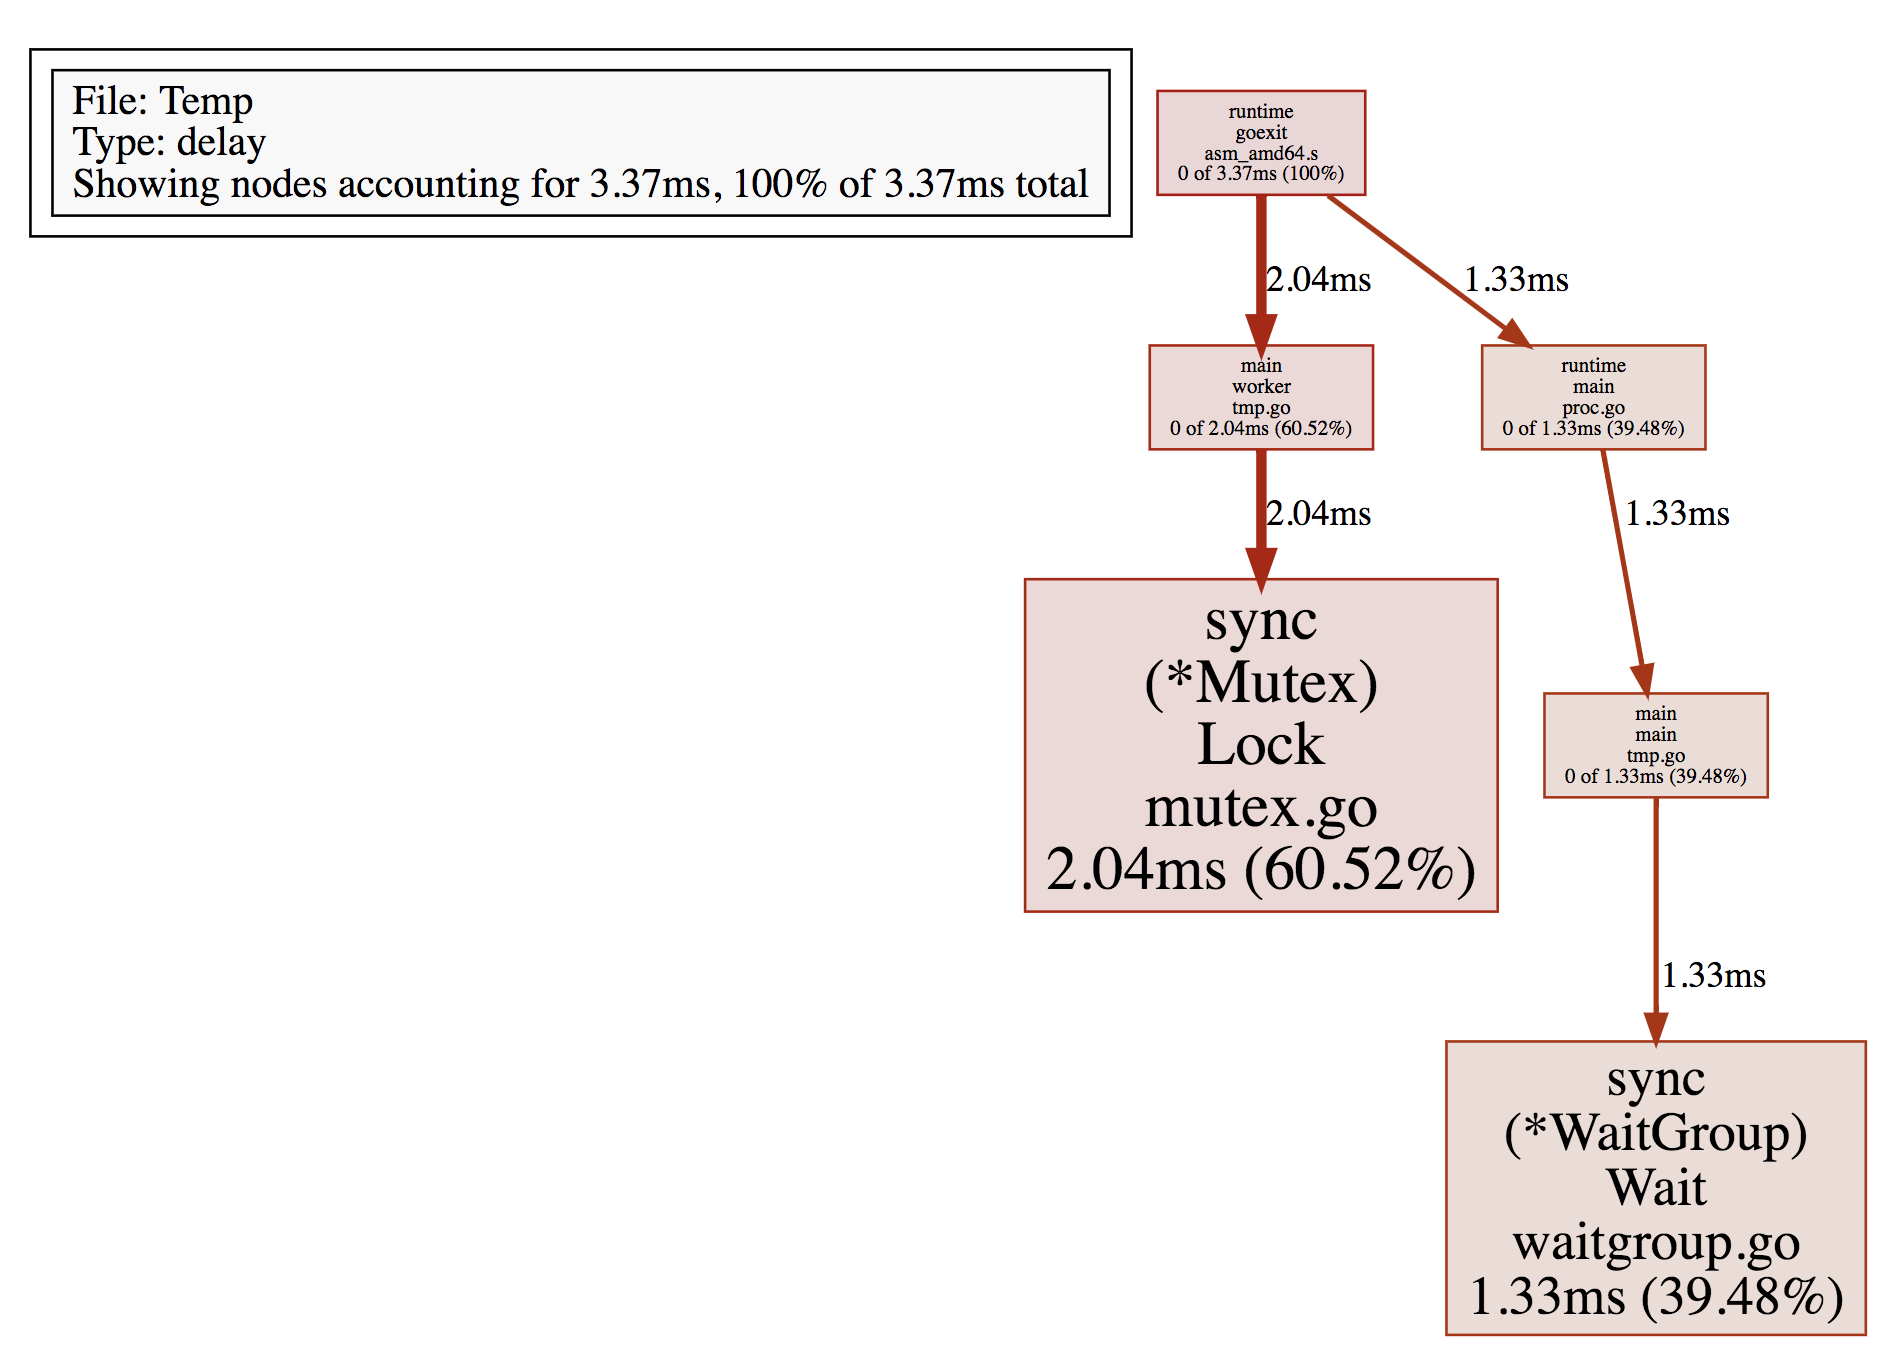
可以很直观地看到整个阻塞调用链,对于耗时较多的阻塞调用加以优化。
2.4 mutexprofile
仍然用2.3中的代码,只需要改两个地方,将 runtime.SetBlockProfileRate(1 * 1000 * 1000) 改为:
// 当 rate = 0 时,关闭 mutex prof (默认值)
// 当 rate = 1 时,表示记录所有的 mutex event
// 当 rate > 1 时,记录 1/rate 的 mutex event(随机)
runtime.SetMutexProfileFraction(1)
再将writeProfTo("block", "block.bprof")改为writeProfTo("mutex", "mutex.mprof")即可,编译运行,并打开 pprof 工具:
▶ go tool pprof bin/Temp mutex.mprof
(pprof) top
Showing nodes accounting for 2.55ms, 100% of 2.55ms total
      flat  flat%   sum%        cum   cum%
    2.55ms   100%   100%     2.55ms   100%  sync.(*Mutex).Unlock /usr/local/Cellar/go/1.9.1/libexec/src/sync/mutex.go
         0     0%   100%     2.55ms   100%  main.main /Users/wudaijun/go/src/ngs/test/tmp/tmp.go
         0     0%   100%     2.55ms   100%  runtime.goexit /usr/local/Cellar/go/1.9.1/libexec/src/runtime/asm_amd64.s
         0     0%   100%     2.55ms   100%  runtime.main /usr/local/Cellar/go/1.9.1/libexec/src/runtime/proc.go
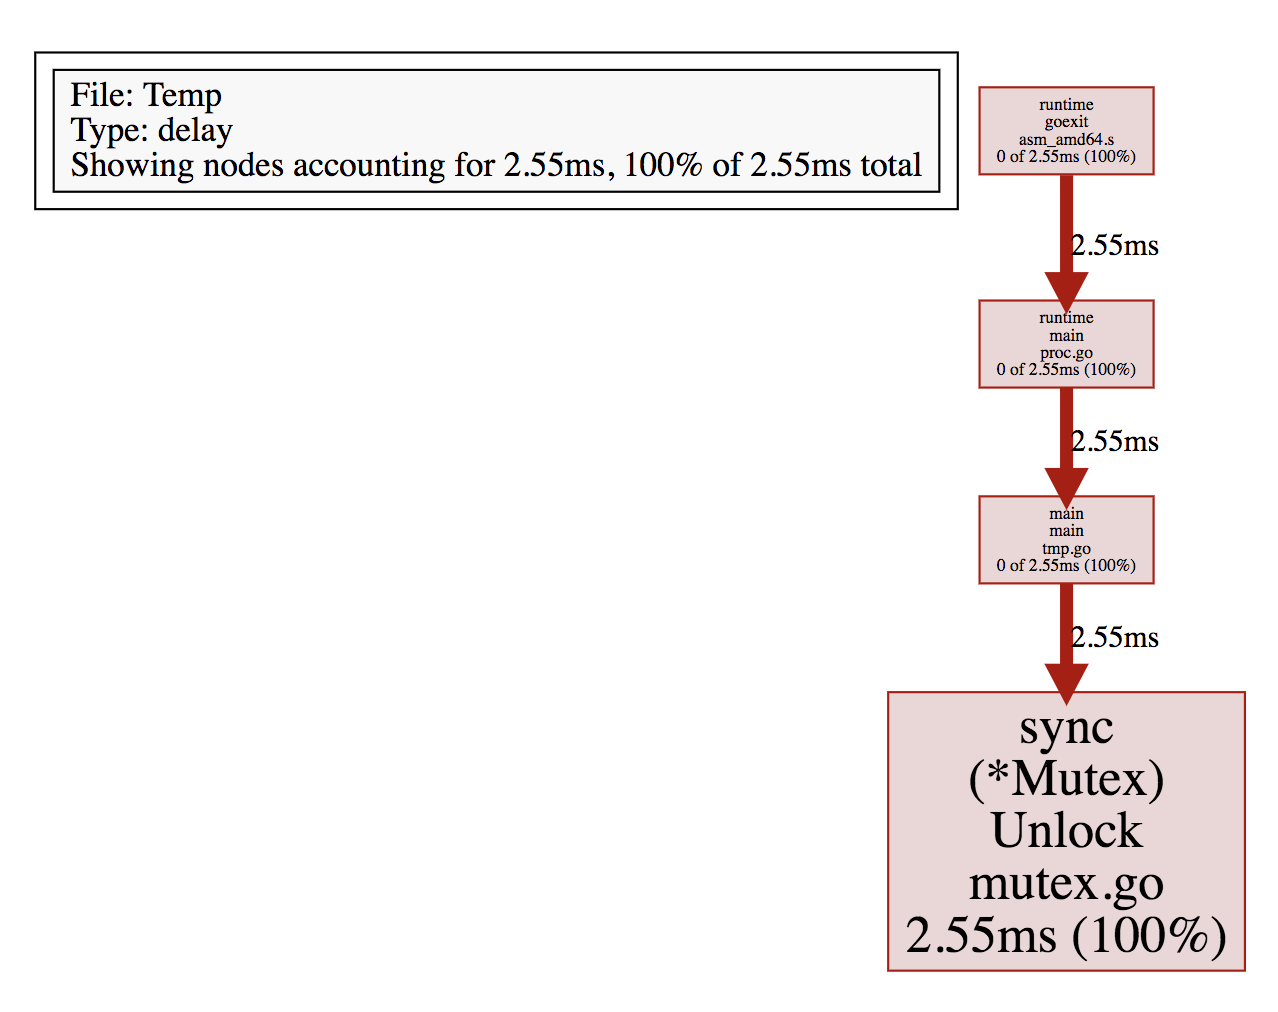
查看 svg 图:
三. 实践 Tips
以下是一些从其它项目借鉴或者自己总结的实践经验,它们只是建议,而不是准则,实际项目中应该以性能分析数据来作为优化的参考,避免过早优化。
- 对频繁分配的小对象,使用 sync.Pool 对象池避免分配
- 自动化的 DeepCopy 是非常耗时的,其中涉及到反射,内存分配,容器(如 map)扩展等,大概比手动拷贝慢一个数量级
- 用 atomic.Load/StoreXXX,atomic.Value, sync.Map 等代替 Mutex。(优先级递减)
- 使用高效的第三方库,如用fasthttp替代 net/http
- 在开发环境加上
-race编译选项进行竞态检查 - 在开发环境开启 net/http/pprof,方便实时 pprof
- 将所有外部IO(网络IO,磁盘IO)做成异步
参考: